The latest Auto Theft Statistics for 2014
We recently published a fun post about the top 10 insurance myths people tend to believe, and one of those myths had to do with vehicle theft. That’s when it hit us, we’ve never done a proper post about auto theft statistics.
Shame on us!
As insurance agents selling auto insurance, this is a critical piece of information we should be sharing with our readers, customers, and friends. It also provided a great reason to use that awesome photo of the new 2015 Ford Mustang!
This won’t happen again, starting with this post, we will publish an annual auto theft statistics report.
| Auto Insurance Theft Quick Facts |
|
Getting to understand auto theft and it’s relationship to your auto insurance
First thing to understand, auto theft is covered under a very specific area of the auto insurance policy called Comprehensive coverage. This coverage is optional in most states, and on most auto insurance policies, so don’t assume it’s going to be available automatically just because you purchased auto insurance. If your auto insurance declarations doesn’t have Comprehensive coverage (sometimes called Other than Collision), then you likely don’t have coverage for auto theft.
National crime statistics are compiled and published by the Federal Bureau of Investigation (FBI), much of this data is directly from their annual report.
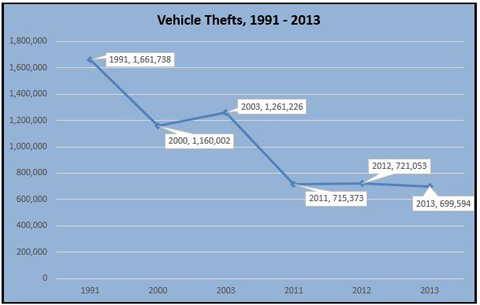
According to the FBI, the number of cars stolen each year has been dropping. In 2013 the number of cars stolen dropped by 3.2%, and in 2014 the number fell by another 1.5%. In fact, vehicle theft has been on the decline for the past 23 years.
Because the rate of vehicle theft is declining each year, people don’t suffer much anxiety that their vehicle will be stolen. This sentiment was corroborated by a Gallop Poll conducted in 2014 where 56% of those survey don’t worry about auto theft.
Much of the reduction in auto theft is due to law enforcement efforts, and local and federal efforts to combat auto theft, as well as technology and insurance company supported organizations like the National Insurance Crime Bureau (NICB).
Even though the rate of vehicle thefts has been declining, the total value in stolen property is still extremely high. In 2014 the value of all stolen vehicles was in excess of $4.5 billion. This means vehicle theft is still a big business in the United States. Typically, it’s our insurance companies that bear this expense, so auto theft is certainly a contributor to your insurance premiums paid.
Here are some useful (fun) facts about auto theft ins the United States:
- The West accounts for the largest share of total auto thefts at 37.1%. The South had a significant share as well at 36.5%, and the Midest and the Northeast were 17.9% and 8.5% respectively.
- Nationally, 216 out of 100,000 can expect to suffer an auto theft.
- In 2014 only 12.8 percent of motor vehicle thefts were cleared, either by arrests or by exceptional means, compared with 21.7 percent for arson and 20.2 percent for all property crimes.
- Autos accounted for 74.5 percent of all motor vehicles stolen in 2014, trucks and buses accounted for 14.9 percent and other vehicles for 10.6 percent.
- Insurance Premiums: The average comprehensive insurance premium in the U.S. rose 0.9 percent to $134.04 in 2012 from $132.78 in 2011 (the most recent data available), according to the National Association of Insurance Commissioners.
- Carjackings: Carjackings occur most frequently in urban areas. They accounted for only 3.0 percent of all motor vehicle thefts, based on Department of Justice data from 1993 to 2002 (latest available).
The cities with the highest theft rates
According to a National Insurance Crime Bureau (NICB) study released in June 2015, the following cities have the highest rate per 100,000 inhabitants for vehicle thefts. for 2014. For those of us who live in California, and those who sell California auto insurance, it’s noteworthy that seven (7) of the top 10 cities for motor vehicle theft were in sunny California.
TOP 10 U.S. CITIES BY MOTOR VEHICLE THEFT RATE, 2014
|
Source: National Insurance Crime Bureau.
Vehicle Thefts by Make or Model
The National Insurance Crime Bureau (NICB) reports that the Honda Accord was the most frequently stolen passenger vehicle in 2014, with 51,290 thefts. The Honda Civic ranked second, with 43,936 thefts. I guess Honda is popular with consumers and thieves alike.
If you drive an older Honda, you’re more likely to have your vehicle stolen. The NICB notes that older Honda Accords and Civics account for most of these thefts, while newer Hondas are rarely stolen, due to improved anti-theft technology.
TOP 10 MOST FREQUENTLY STOLEN VEHICLES, 2014
|
(1) Includes all model years for each vehicle.
Source: National Insurance Crime Bureau.
Of the new model year vehicles, those that are stolen less frequently, there are still clear targets. Some of it has to do with the fact that there are just more of these types of vehicles, for instance, the Ford F-150 and Toyota Camry are two of the most popular models sold year-over-year.
The following chart shows the top ten model year 2013 vehicles that were most frequently stolen in calendar year 2013.
TOP 10 MOST FREQUENTLY STOLEN VEHICLES, 2014 MODEL YEAR
|
Source: National Insurance Crime Bureau.
Sometimes it has to do with where you live. According to the FBI, California has the highest vehicle thefts in the United States. So if you, like me, live in California, you live in the state with the most vehicle thefts. It is true, California also has the most vehicles insured and purchased as well.
TOP 10 STATES WITH THE MOST AND THE FEWEST NUMBER OF MOTOR VEHICLE THEFTS, 2014
| ||||||||||||||||||||||||||||||||||||||||||||||||||||||||||||||||||||||||
Source: U.S. Department of Justice, Federal Bureau of Investigation, Uniform Crime Reports.
MOTOR VEHICLE THEFT IN THE UNITED STATES, 2005-2014
|
Source: U.S. Department of Justice, Federal Bureau of Investigation, Uniform Crime Reports.
The history of enforcement of anti-theft laws?
- Federal intervention to fight vehicle theft began in 1919 with the Dyer Act. This act made interstate transportation of a stolen car a federal crime.
- In 1984 Congress passed the Motor Vehicle Theft Enforcement Act, toughening the penalties for stolen vehicle parts. This law also required manufactures to stamp ID numbers on major car components and parts.
- Also in 1984 it became a federal offense to counterfeit or forge motor vehicle title certificates.
- In 1985 the Department of Transportation required that 14 major vehicle parts be inscribed with a 17-digit vehicle identification number (VIN)
- In 1992 the Anti-Car Theft Act made “carjacking” a federal crime.
- The Violent crimes Control and Enforcement Act made carjacking that resulted in a death a federal crime subject to the death penalty. Also under this act repair shops the sell marked, used parts, were compelled to check the VIN’s against the FBI stolen car database.
Additional measure taken to combat auto theft
The National Insurance Crime Bureau (NICB) combats auto theft by investigating cases referred to it by insurers and through its online databases. The databases allow member insurance companies to search files by driver identification data and also by license plate numbers, VINs and component vehicle part and type numbers. Information leading to the identification of the vehicle used in the World Trade Center bombing of 1993 was obtained through an NICB database that allows the user to enter a partial VIN. The complete VIN was reconstructed and matched to a van stolen from a truck rental company on the day of the bombing. The search service (VINCheck) is available to the public.
In the 1980’s states and regions experiencing high auto thefts began to form Anti-Car Theft (ACT) groups funded by grants from coalitions of law enforcement groups, state funds, insurers and consumers to promote public awareness of vehicle theft and lobby for the passage of state legislation aimed at combating thefts. By the end of 2014, 14 states had created Automobile Theft Prevention Authorities (ATPAs), mostly funded by surcharges on auto insurance policies. Michigan pioneered the ATPA concept in 1986, allocating $1 from each auto insurance policy to combating auto theft. Michigan’s program, called Help Eliminate Auto Theft (HEAT) includes a hotline for residents to report thefts and chop shop operations. From 1985 to 2010 information forwarded to HEAT resulted in the recovery of more than 4,200 vehicles, valued at more than $51 million, and has led to the arrest of almost 3,400 suspects. ATPAs and other state entities such as ACT groups use a wide range of programs to fight auto theft. Combat Auto Theft (CAT) programs involve auto owners who voluntarily put stickers on their windshields that alert police that they can stop the car for a theft check after a certain hour.
Component Theft: More than 75,000 airbags are stolen every year, according to estimates by the Insurance Information Institute. NICB says that airbag theft costs insurers and vehicle owners more than $50 million a year. New airbags cost about $1,000 from a car dealer; on the black market the cost is between $50 and $200. To thwart thieves, steering wheel covers used with a steel bar steering wheel lock are available. New York combats airbag theft by requiring accident reports to note airbag deployment, and specifies procedures for auto repair shops to follow when replacing stolen or deployed airbags. Xenon headlights and global positioning systems (GPS) are also popular with thieves. By mid-2008, insurers and the NICB had observed a growing nationwide trend in the theft of catalytic converters. These components contain small amounts of platinum and palladium, precious metals whose value has risen with the use of catalytic converters and the growth in popularity of platinum jewelry.
Anti-theft Devices: Consumers spend hundreds of millions of dollars on vehicle security devices. Electronic tracking devices such as LoJack use a hidden transmitter to allow police to track the vehicle. (LoJack, which operates in 26 states and the District of Columbia claims a better-than 90 percent recovery rate.) These tracking devices not only help police find individual stolen vehicles but lead them to chop shops, thwart the export of stolen motor vehicles and lead to the recovery of expensive building construction vehicles as well as passenger cars. Some insurers offer their policyholders a LoJack tracking system at a discounted price along with premium discounts.
Insurer Discounts: According to the National Association of Insurance Commissioners, in nine states (Florida, Illinois, Kentucky, Louisiana, Massachusetts, Minnesota, New Mexico, Pennsylvania and Rhode Island) regulations require insurers to provide car owners with discounts on the base rates for comprehensive insurance for anti-theft devices. In four other states insurers may offer these discounts or are encouraged to offer them. The amount of the discount varies but is typically 15 to 20 percent for passive devices, which are automatically activated when the vehicle is locked. Massachusetts residents are eligible for a minimum 25 percent discount if they have both an anti-theft device and an auto recovery system, and some combinations of devices can result in a 36 percent discount. Insurance companies in states that do not mandate discounts, such as Georgia, New Jersey, New York and Washington, encourage car owners to install anti-theft devices by voluntarily providing discounts.
Conclusion
Vehicle theft continues to be large cost incurred by auto insurance companies. Throughout the years, law enforcement, insurance companies and anti-theft organizations, and the market have worked to combat vehicle-theft, bringing the rate down year-over-year. There is still a lot of work ahead, but with continued diligence, this will continue to be less an issue for the average consumer.
Image Source: Vlad Sorodoc

Compare Quotes Online
Want to know if you can save on home or auto insurance? See for yourself. Start a quote today.
Give us a Ring
1-877-334-7646
Call today and speak with a professional insurance agent.